The Ambulatory Glucose Profile (AGP) is a representation of many days of glucose readings displayed as if all the readings had occurred in a single 24-hour period.
Although the content of the AGP is standardised, the way the report looks does vary a little from device to device. The following is what the AGP from a Freestyle Libre looks like:
What does an Ambulatory Glucose Profile look like?
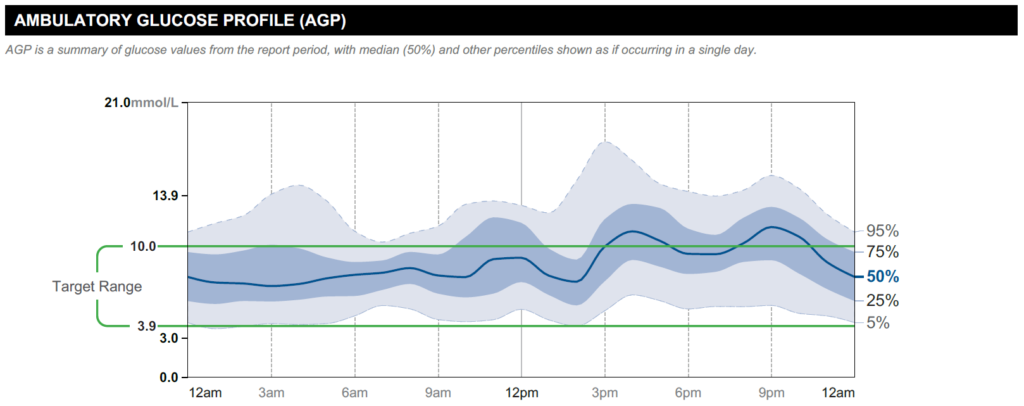
PARALLEL GREEN LINES: Target Glucose Range – This is where glucose levels should be as much as possible. The target glucose range is usually 3.9 mmol/L – 10 mmol/L.
BLACK/BLUE SOLID LINE: Median Line – The ‘average’ (middle) point of all your glucose levels that shows ‘what usually happens’ during a day. Look at whether it is within the target glucose range and how much it fluctuates throughout the day.
INNER BLUE-SHADED BAND: This band indicates where glucose levels are ‘half the time’. Look at the band’s width throughout the day. The wider this band is, the more variable the glucose levels are day-to-day.
OUTER GREY-SHADED BAND: This band indicates more ‘occasional’ high or low glucose levels. Look at areas where the band is widest, this indicates more day-to-day variation at these times.